- Attractive Education
- Beginner to Advance
- Flexible Timing

In the world of financial trading, Japanese candlesticks are among the most important tools used by traders to analyze markets and understand price movements. This tool has its origins in the 18th century in Japan, where it was used to track rice prices. Today, Japanese candlesticks are considered one of the foundations of technical analysis relied upon by many traders in various financial markets, whether in stocks, currencies, or commodities.
In this article, we will explain in detail what Japanese candlesticks are, how to read and analyze them, as well as their different types and the most famous patterns that can help you make more informed trading decisions.
Japanese candlesticks are a method of presenting prices in financial markets in the form of charts. Each candlestick represents a specific time period (minute, hour, day, etc.) and illustrates four key points: the opening price, the closing price, the highest price, and the lowest price during that period. The body of the candlestick consists of the filled part that shows the difference between the opening price and the closing price, while the thin lines above and below the body (known as the “wick” or “shadow”) indicate the highest and lowest prices during the same period.
If the closing price is higher than the opening price, the candlestick is usually green (or white), indicating a bullish trend. Conversely, if the closing price is lower than the opening price, the candlestick is red (or black), reflecting a bearish trend.
Trading is not just about random buying and selling; it is a process based on studying and analyzing price movements in the market. This is where the benefit of Japanese candlesticks comes in, as they provide traders with the ability to:
-Understand general trends: Is the market in an upward or downward trend?
-Identify turning points: When might the market’s direction change?
-Analyze patterns: Reveal past price behavior and predict future movements.
By understanding the different patterns of Japanese candlesticks, you can make more accurate decisions regarding entering and exiting trades.
The doji candle is one of the most important candles to pay attention to in trading. This candle is characterized by the opening price being almost equal to the closing price, which means that the market has not yet decided on the final direction. The appearance of a doji candle can indicate a potential change in trend, especially if it appears after a long upward or downward trend.

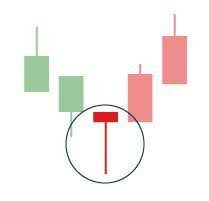
The hammer candle is characterized by a small body and a long lower shadow. If this candle appears after a downtrend, it is considered a signal that selling pressure has ended, and a bullish reversal may occur in the market. This type of candle indicates that buyers have started to enter the market strongly, leading to a price increase after a significant decline.

The hanging man candle resembles the hammer candle, but it appears at the end of an uptrend. If you see this candle at the top of an uptrend, it may signal a potential bearish reversal. It indicates that buyers have started to retreat, which could cause a decline in the market.

Bullish Engulfing: This pattern occurs when a large bullish candle follows a small bearish candle, indicating buyer dominance in the market and the potential for rising prices.
Bearish Engulfing: Conversely, this pattern appears when a large bearish candle follows a small bullish candle, indicating seller dominance and the potential for falling prices.

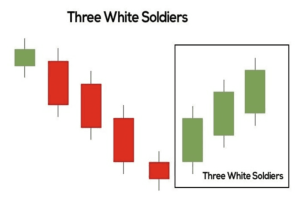
This pattern appears when three consecutive bullish candles are formed, with each candle closing higher than the previous one. This indicates a strong bullish trend and is usually a good signal for investment or buying.

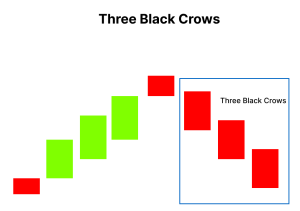
This pattern represents three consecutive bearish candles, with each candle closing lower than the previous one. This pattern is considered a sign of a strong bearish trend and suggests that the market may experience continued declines.

Recognizing Patterns: The first thing you need is to recognize the different candlestick patterns and understand what they mean. When you see a particular candle, ask yourself: “What does this tell me about the current trend?”
Analyzing Context: You cannot rely solely on candlestick patterns; you must also consider the overall market context, such as news and other analyses.
Using Candlesticks with Other Indicators: Just like moving averages or the Relative Strength Index (RSI), candlestick patterns can provide stronger signals when used alongside other analytical tools.
Avoid entering trades based on a single candle: While candlestick patterns are important, it is better to wait for confirmations from the market or use other analytical tools.
Learn patience and discipline: Success in trading requires patience. Do not enter a trade just because you saw a particular pattern; ensure that all indicators support your decision.
Monitor long-term and short-term trends: Always try to look at the bigger picture of the market and do not rely solely on short time frames.
In conclusion, candlestick patterns are not just a way to display prices; they are a powerful analytical tool that can help you understand market movements and identify entry and exit points for trades. If you are a beginner in the trading world, understanding candlestick patterns and their formations will enhance your ability to make informed decisions. Invest time in learning them, and you will find yourself closer to achieving profits through smarter and more professional trading.
You can learn more about candlestick patterns and formations interactively through here.
You can also follow everything related to trading through the educational series “Trading for Beginners” on the YouTube channel through here.
This site is protected by reCAPTCHA and the Google
Privacy Policy and
Terms of Service apply.