Introduction
In the world of trading, success is not just about following price movements — it requires a deeper vision of what happens behind the scenes. Technical indicators are not just chart tools; they are powerful instruments that reveal the true market dynamics and are a cornerstone relied upon by more than 85% of professional traders.
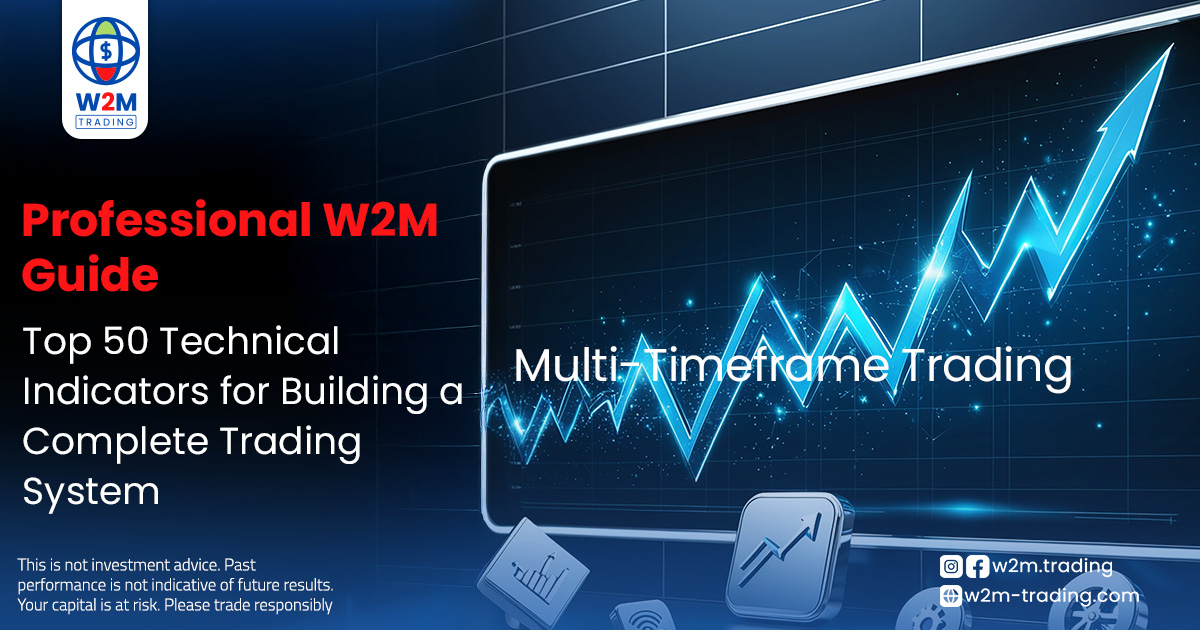
In this comprehensive W2M guide, we provide you with a complete “roadmap” of the 50 strongest technical indicators, which will serve as the building blocks you need to create an effective and profitable trading strategy, whether you trade forex, stocks, or cryptocurrencies.
1. Trend Indicators
These indicators are your compass in the market, helping you distinguish between bullish, bearish, or sideways trends.
Simple Moving Average (SMA): The simplest and strongest tool to identify the overall trend. We recommend periods like 50, 100, and 200 for a clear view of long-term trends.
Exponential Moving Average (EMA): Gives more weight to recent data, making it more responsive to price changes. Ideal for day traders looking for faster signals.
Weighted Moving Average (WMA): Focuses on the latest data to provide more accurate signals in volatile markets.
Parabolic SAR: Excellent for identifying potential trend reversal points. Particularly effective in strong-trending markets.
Ichimoku Cloud (Ichimoku Kinko Hyo): An integrated system that combines trend identification, support/resistance, and momentum. Provides a complete market picture across all timeframes.
2. Momentum Indicators
These measure the speed and strength of price movements, helping you know whether the current move is strong or weak.
Relative Strength Index (RSI): The most famous tool for identifying overbought (above 70) and oversold (below 30) levels, signaling potential reversals.
Stochastic Oscillator: Compares closing price to the price range over a set period. Ideal for identifying turning points in range-bound markets.
MACD: Combines moving averages to give strong crossover signals when momentum shifts. A core indicator in any system.
Commodity Channel Index (CCI): Good for identifying overbought/oversold conditions.
Williams %R: Similar to Stochastic, effective at identifying market tops and bottoms.
3. Volatility Indicators
Volatility is the fuel that drives the market. These help you measure the size of moves and time big shifts.
Bollinger Bands: Measure market volatility around a moving average. Band contractions indicate an imminent strong price move.
Average True Range (ATR): Measures the average size of price swings. Essential for risk management and position sizing.
Keltner Channels: Similar to Bollinger Bands, but work better in strongly trending markets.
Donchian Channels: Identify the highest high and lowest low over a set period. Basis of the famous “Turtle Strategy.”
Chaikin Volatility: Measures changes in volatility. Useful for anticipating upcoming big moves.
4. Volume Indicators
Volume is the driving force behind every price move. Understanding it helps confirm trend strength.
Volume: The simplest and most important volume indicator. Strong moves should always be backed by high volume.
On-Balance Volume (OBV): Links volume to price changes. Helps anticipate big moves before they occur.
Money Flow Index (MFI): Combines volume and momentum. Works like RSI but adds the volume element.
VWAP (Volume-Weighted Average Price): Reflects the average price at which the asset has been traded. Essential for institutional traders.
Accumulation/Distribution: Shows whether big players are buying or selling the asset.
5. Support and Resistance Indicators
These identify price levels where moves are likely to pause or reverse.
Pivot Points: Identify daily support and resistance levels. A must for day traders.
Fibonacci Retracement: Identifies possible correction levels. Effective in all markets.
Fibonacci Fans: A dynamic version of Fibonacci, providing angled support/resistance levels.
Camarilla Pivots: Provide more precise support and resistance levels.
Woodies Pivots: An advanced pivot system that delivers clear trade signals.
6. Cryptocurrency-Specific Indicators
These are designed for analyzing the unique nature of crypto markets.
Hash Rate: Measures Bitcoin network power, reflecting its health and security.
Mining Difficulty: Tied to miners’ performance, affects market supply.
Coin Flow: Tracks coin movements between wallets, predicts large shifts.
Stock-to-Flow (S2F): Measures asset scarcity, famous in long-term Bitcoin analysis.
Velner Indicator: Combines price and volume, designed for cryptocurrencies.
7. Advanced Indicators for Professionals
Provide deeper insights and require advanced market understanding.
Zig Zag: Filters out small fluctuations to show underlying trends clearly.
GMMA (Guppy Multiple Moving Average): A group of moving averages for short- and long-term trends.
DeMarker Indicator: An improved RSI, less affected by sudden volatility.
Fisher Transform: Converts prices to a Gaussian distribution, providing precise signals.
Elder Ray: Measures bulls vs bears’ strength, often used with Elder Impulse system.
8. Price Action Analysis Tools
Focus on where trading activity is concentrated.
Volume Profile: Shows volume distribution at different price levels. Essential for spotting liquidity zones.
Point of Control (POC): The price level with the highest volume, acts as strong support/resistance.
Value Area High (VAH): Area of heavy trading above POC, potential resistance.
Value Area Low (VAL): Area of heavy trading below POC, potential support.
VWAP (Volume-Weighted Average Price): Combines price and volume, essential for institutional traders.
9. Risk Management Indicators
No successful system works without strong risk management.
Risk/Reward Ratio: Foundation of any profitable strategy. Aim for 1:2 or higher.
Daily Loss Limit: Prevents catastrophic losses.
Sharpe Ratio: Measures returns against risk, essential for evaluating your system.
Sortino Ratio: Focuses on downside risk, more accurate than Sharpe.
Max Drawdown: Measures the largest consecutive loss, key for capital management.
10. Market Sentiment Indicators
These help you understand investor psychology and the moves of big players.
Fear & Greed Index: Measures investor sentiment, effective for spotting market tops/bottoms.
Money Flow: Tracks capital inflows/outflows, predicts institutional moves.
Put/Call Ratio: Measures options balance, a strong reversal signal.
VIX (Volatility Index): Known as the “fear index,” measures expected volatility in equities.
Smart Money Flow Index: Tracks the moves of large investors, giving early signals.
Conclusion: How to Build Your Perfect Trading System with W2M
Don’t look for a “magic indicator”; the secret of success is building a complete system.
Choose 3–5 indicators from different categories (such as trend, momentum, and volume).
Backtest and verify: Test your system on a demo account for at least 3 months.
Optimize: Record results and adjust your indicators until you reach the optimal mix.
Discipline: Stick to your system once proven effective, to achieve consistent and profitable results.
At W2M, we believe that understanding how indicators interact under different market conditions is the key to professionalism. Join us today to start your journey toward professional trading.
This site is protected by reCAPTCHA and the Google
Privacy Policy and
Terms of Service apply.